library(tidyverse)
library(stringr)
states <- map_data("state")Create percent a and b
states<-as.tibble(states) %>%
  mutate(state=region) %>%
  #group_by(state) %>%
  mutate(percent_a = sample(1:15537)) %>%
  mutate(percent_a = (percent_a/15537) * 100)
## Warning: `as.tibble()` is deprecated as of tibble 2.0.0.
## Please use `as_tibble()` instead.
## The signature and semantics have changed, see `?as_tibble`.
## This warning is displayed once every 8 hours.
## Call `lifecycle::last_warnings()` to see where this warning was generated.#dat<-statesRound percent_a
states<-states %>%
  mutate(percent_a = round(percent_a, 2))
Create percent_b
states<-states %>%
  mutate(percent_b = 100-round(percent_a, 2))
Map percentages
states %>%
  ggplot() +
  geom_polygon(aes(x = long, y = lat, fill = percent_a, group = group), color = "white") +
  coord_fixed(1.3) +
  guides(fill=FALSE) +
  theme_bw()# do this to leave off the color legend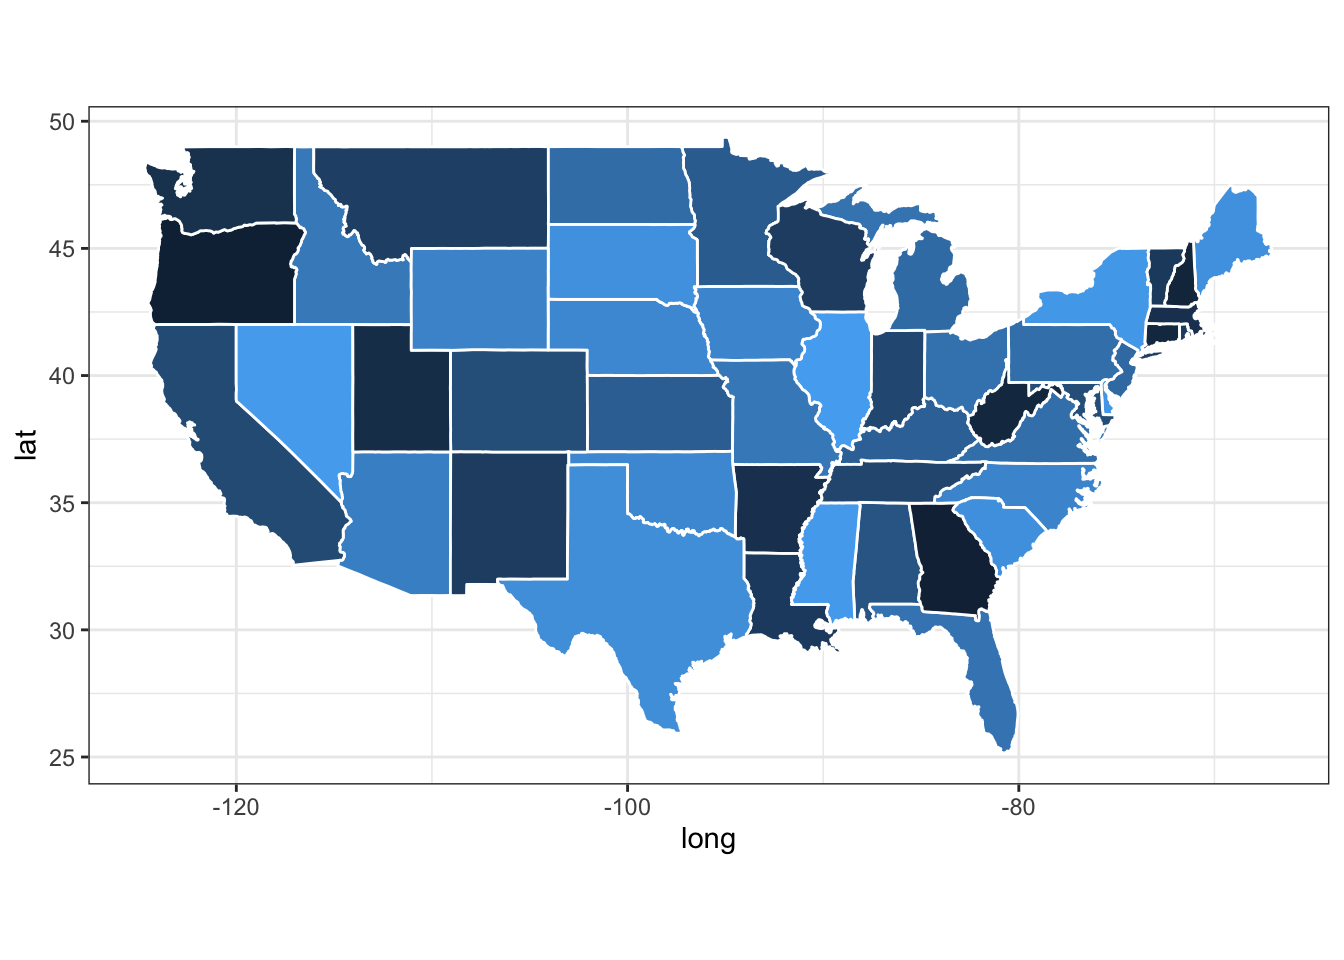
Map binary outcomes variable + map
states %>%
  mutate(winner = ifelse(percent_a > percent_b, "a", "b")) %>%
  ggplot() +
  geom_polygon(aes(x = long, y = lat, fill = winner, group = group), color = "white") +
  coord_fixed(1.3) +
  guides(fill=FALSE) +
  theme_bw()# do this to leave off the color legend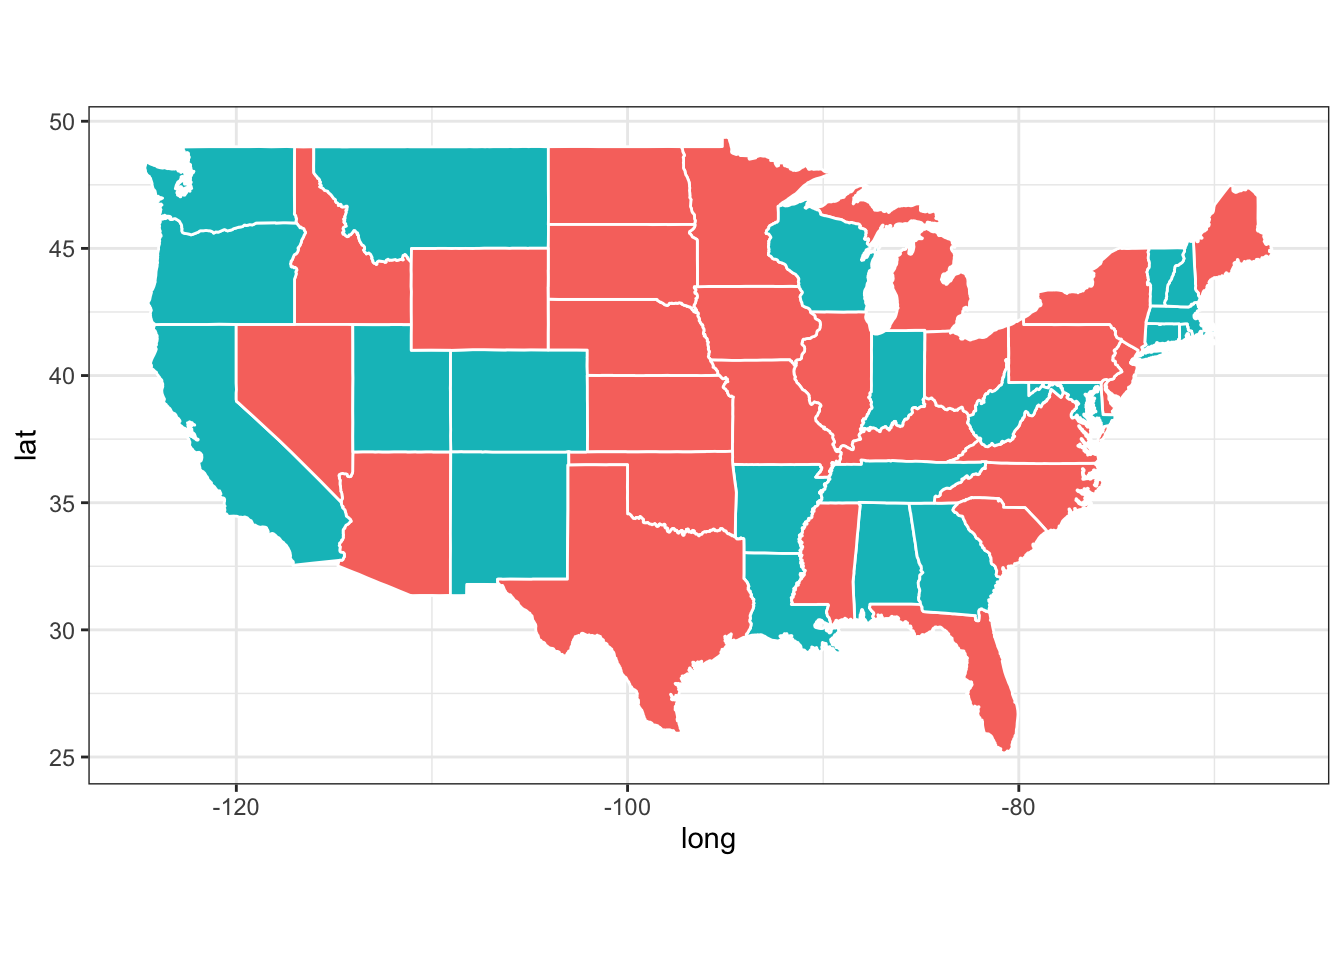
Now make a function to create the variables we want
create_map_vars<-function(x){x %>%
                  as.tibble(.) %>%
  mutate(state=region) %>%
  mutate(percent_a = sample(1:15537)) %>% #this creates the percentage for each row
  mutate(percent_a = (percent_a/15537) * 100)  %>%
    mutate(percent_a=round(percent_a, 2)) %>%
  mutate(percent_b = 100-(percent_a)) %>%
  mutate(winner = ifelse(percent_a > percent_b, "a", "b")) %>%
    mutate(margin_a = percent_a - percent_b)

  }
Apply this function to the data and Save it as ‘dat’
dat<-create_map_vars(map_data("state"))Map binary winner outcome
  dat %>%
  ggplot() +
  geom_polygon(aes(x = long, y = lat, fill = winner, group = group), color = "white") +
  coord_fixed(1.3) +
  guides(fill=FALSE) +
  theme_bw()# do this to leave off the color legend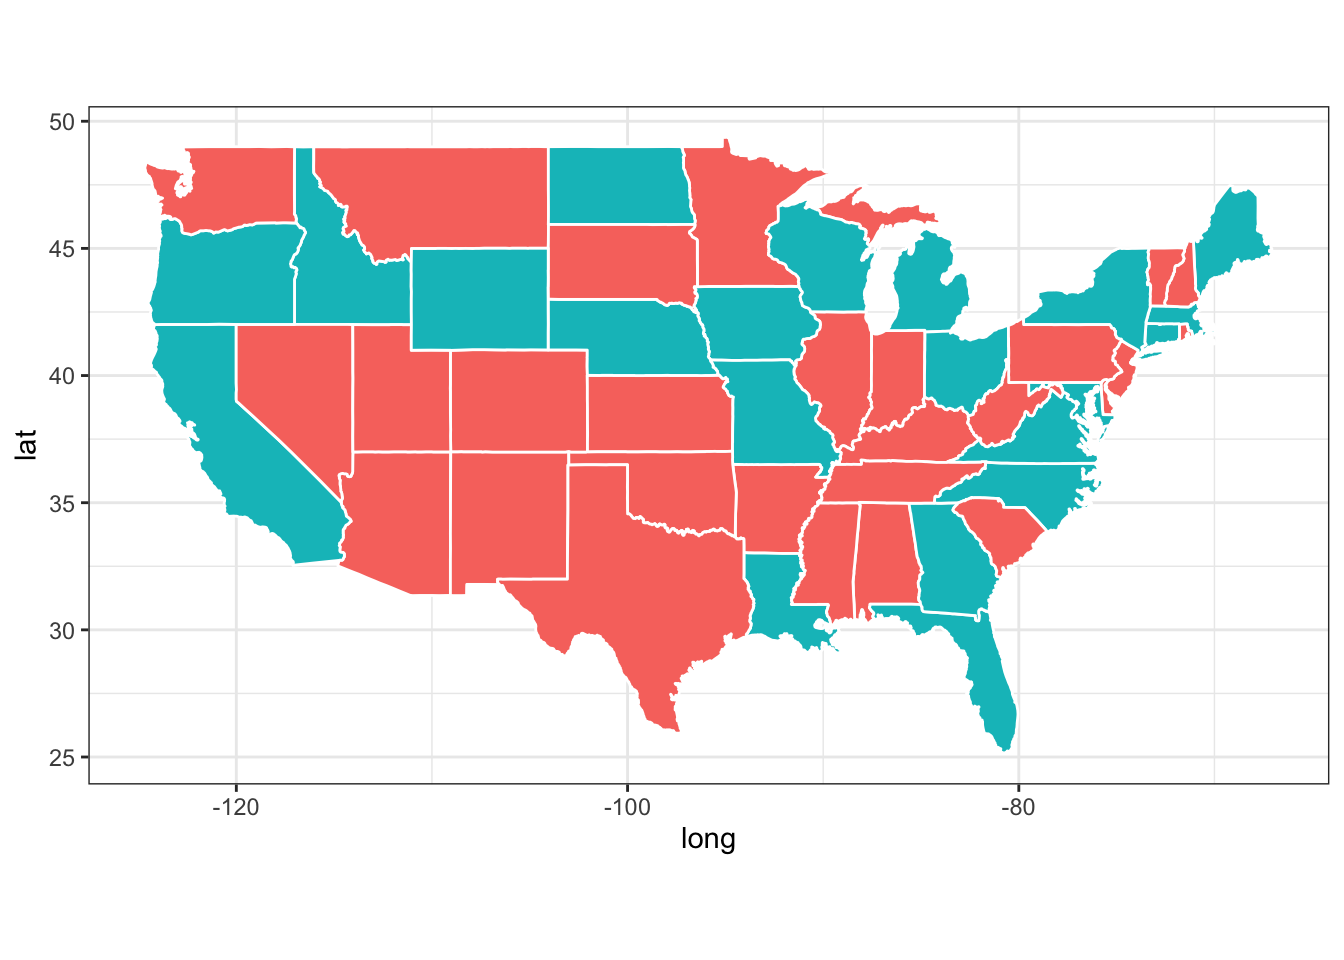
Make function to plot percentage
plot_percent<-function(x){x %>%
  ggplot() +
  geom_polygon(aes(x = long, y = lat, fill = margin_a, group = group), color = "white") + #x = longitude
  coord_fixed(1.3) +
  theme_bw()+
    scale_fill_gradient2(low="red", high="blue")+
    theme(legend.position = "false")}
This is basically a “random” result of a US federal election
plot_percent(dat)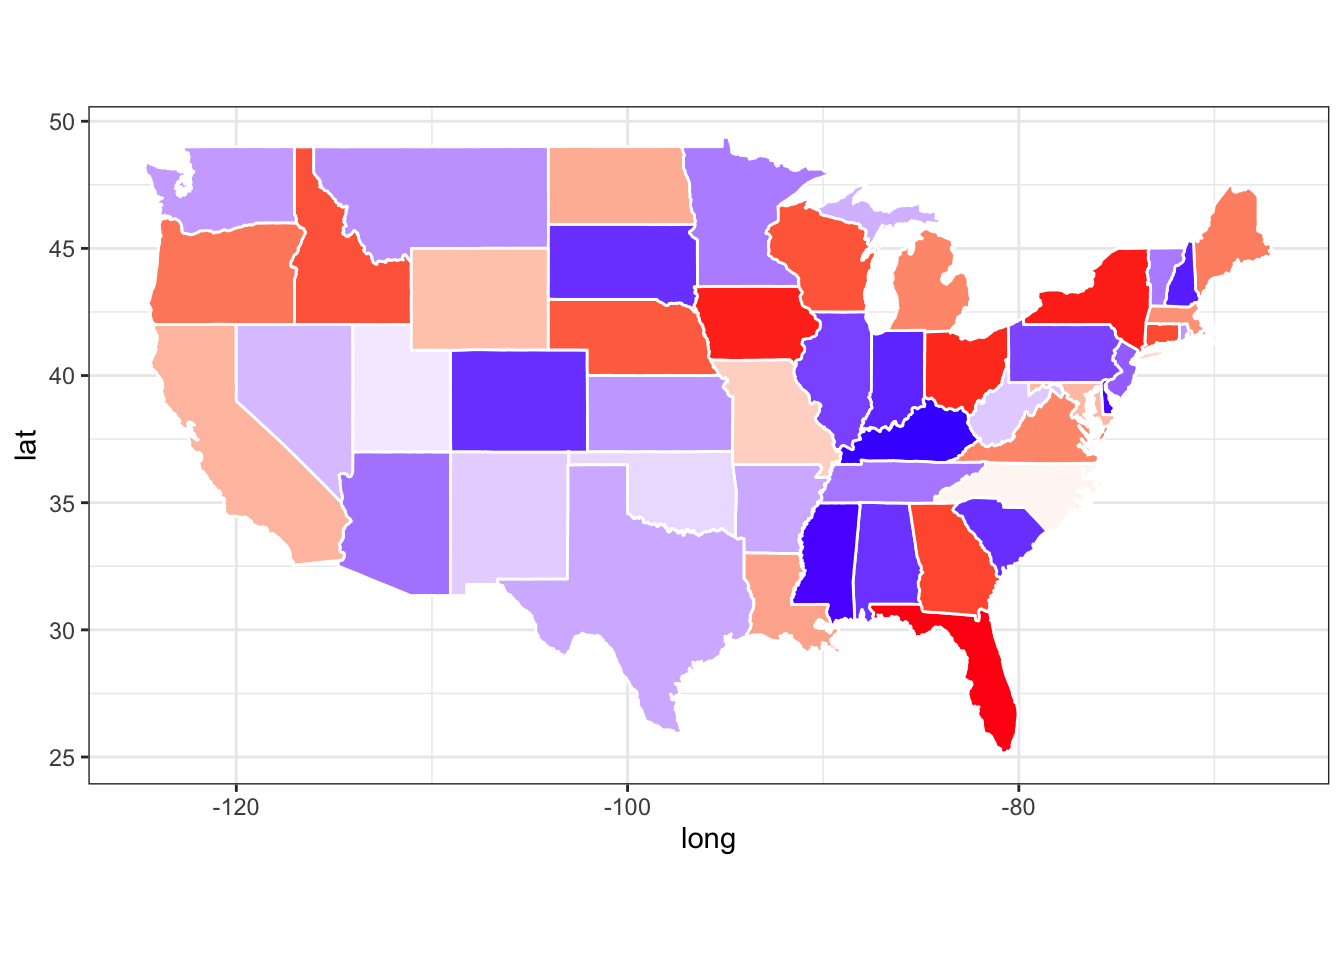
With real data
Thankfully, a lot of people have taken the time to carefully document election results and make that data available to the public
Here I am importing data from the MIT xxxx project (website)
pres_dat<-read_csv("1976-2016-president.csv")Create 2008 Winners dat
map_2008_dat<-pres_dat %>% select(year, state,candidate, party, state_votes=candidatevotes) %>%
  filter(year==2008) %>%
  unique() %>%
  na.omit() %>%
  group_by(state) %>%
  mutate(state_total=sum(state_votes)) %>%
  mutate(percent = round((state_votes / state_total) * 100, 2)) %>%
  mutate(winner=ifelse(percent == max(percent), 1, 0)) %>%
  filter(winner==1) %>% select(-winner)
Create 2012 Winners dat
map_2012_dat<-pres_dat %>% select(year, state,candidate, party, state_votes=candidatevotes) %>%
  filter(year==2012) %>%
  unique() %>%
  na.omit() %>%
  group_by(state) %>%
  mutate(state_total=sum(state_votes)) %>%
  mutate(percent = round((state_votes / state_total) * 100, 2)) %>%
  mutate(winner=ifelse(percent == max(percent), 1, 0)) %>%
  filter(winner==1) %>% select(-winner)
Create 2016 Winners dat
map_2016_dat<-pres_dat %>% select(year, state,candidate, party, state_votes=candidatevotes) %>%
  filter(year==2016) %>%
  unique() %>%
  na.omit() %>%
  group_by(state) %>%
  mutate(state_total=sum(state_votes)) %>%
  mutate(percent = round((state_votes / state_total) * 100, 2)) %>%
  mutate(winner=ifelse(percent == max(percent), 1, 0)) %>%
  filter(winner==1) %>% select(-winner)
winners_2008_dat<-map_2008_dat %>% arrange(year, state) %>% ungroup() %>% mutate(state=tolower(state))winners_2012_dat<-map_2012_dat %>% arrange(year, state) %>% ungroup() %>% mutate(state=tolower(state))winners_2016_dat<-map_2016_dat %>% arrange(year, state) %>% ungroup() %>% mutate(state=tolower(state))map_dat_2008<-merge(dat, winners_2008_dat, by="state")
map_dat_2012<-merge(dat, winners_2012_dat, by="state")
map_dat_2016<-merge(dat, winners_2016_dat, by="state")For some reason, 2012 isn’t working correctly;
Fix 2012
map_dat_2012<-map_dat_2012 %>% mutate(party=ifelse(party=="democratic-farmer-labor", "democrat", party))Make function to plot percentage
plot_percent<-function(x){x %>%
  ggplot() +
  geom_polygon(aes(x = long, y = lat, fill = factor(party), group = group), color="white", alpha=0.75) +
  coord_fixed(1.3) +
  theme_void()+
  scale_fill_manual(values=c("blue", "red"))+
  theme(legend.position = "false")}
Here we can plot each election seperately
plot_percent(map_dat_2008) +
  ggtitle(2008) +
  theme(plot.title = element_text(size = 28, face = "bold", hjust=0.5))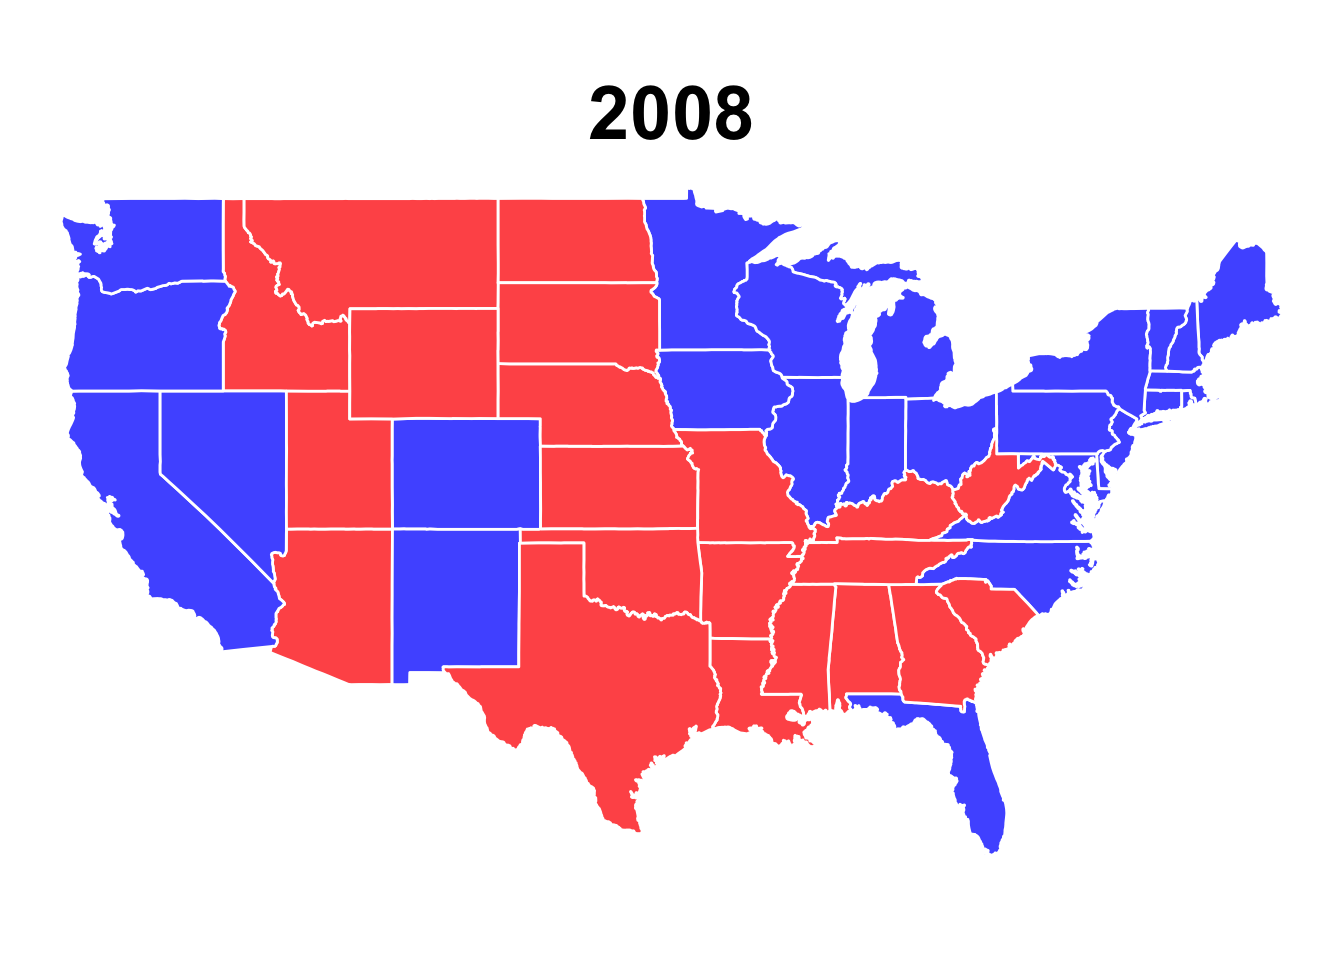
#

plot_percent(map_dat_2012)+
  ggtitle(2012) +
  theme(plot.title = element_text(size = 28, face = "bold", hjust=0.5))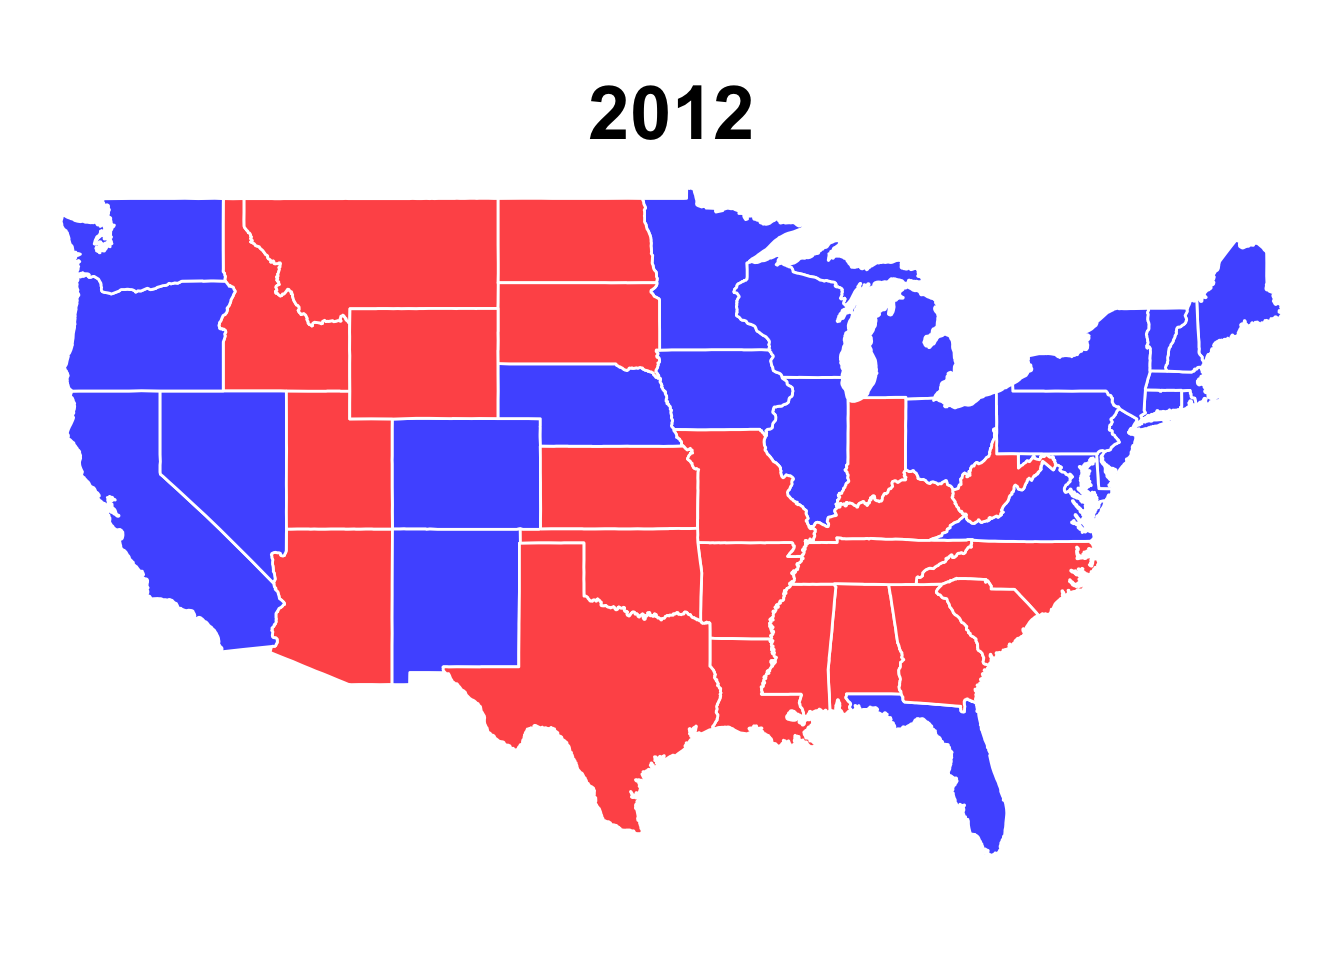
#

plot_percent(map_dat_2016)+
  ggtitle(2016) +
  theme(plot.title = element_text(size = 28, face = "bold", hjust=0.5))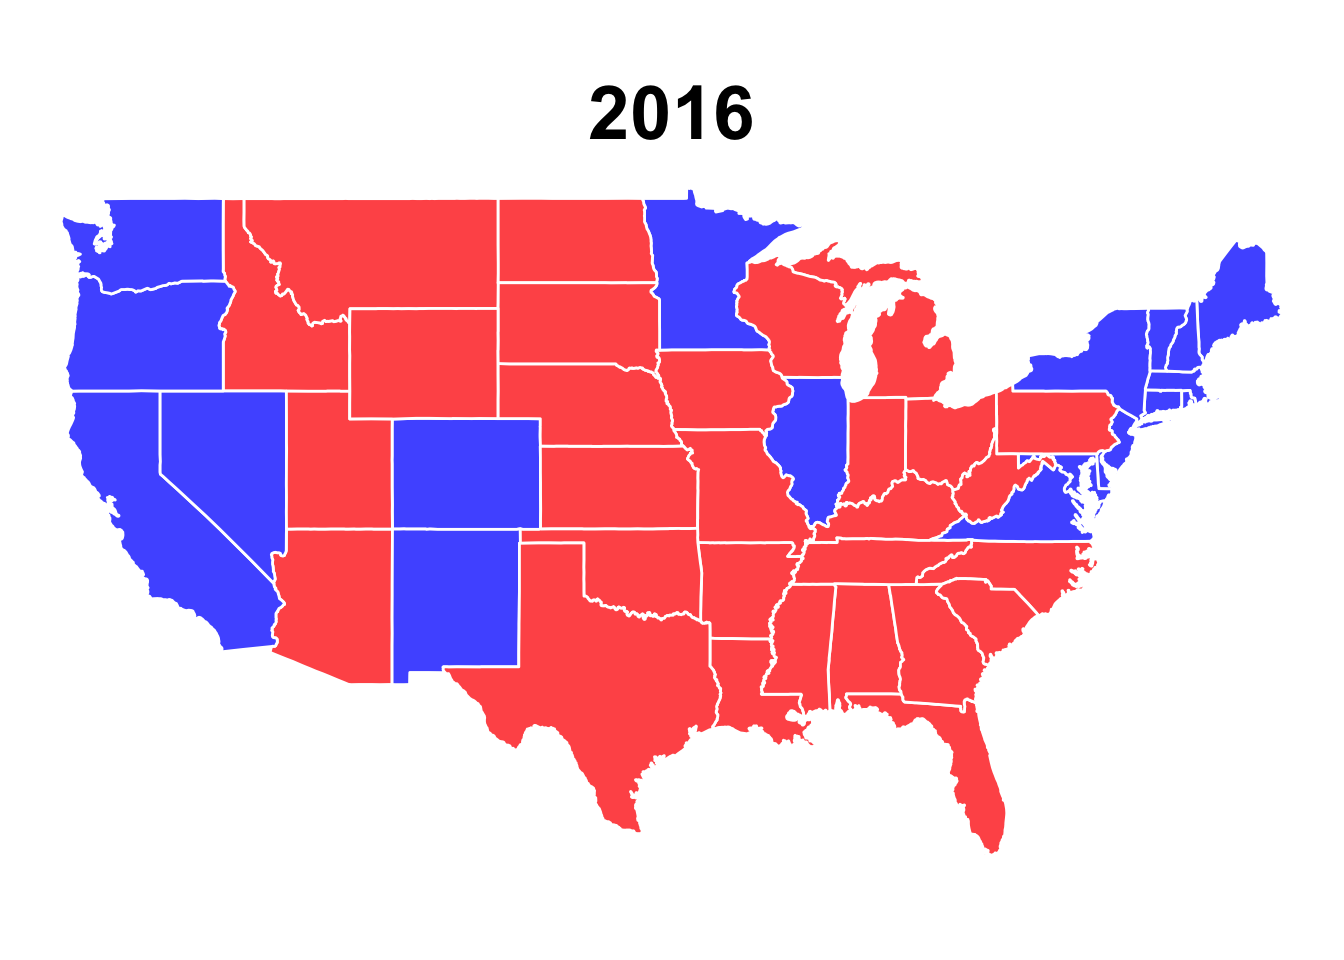
n
dat_2008_2016<-bind_rows(map_dat_2008, map_dat_2012, map_dat_2016)plot_percent(dat_2008_2016)+
ggtitle("Presidential Elections: 2008 - 2016") +
theme(plot.title = element_text(size = 28, face = "bold", hjust=0.5))+
facet_wrap(~year, nrow = 3)+
theme(strip.text.x = element_text(size = 20, colour = "black", face="bold"))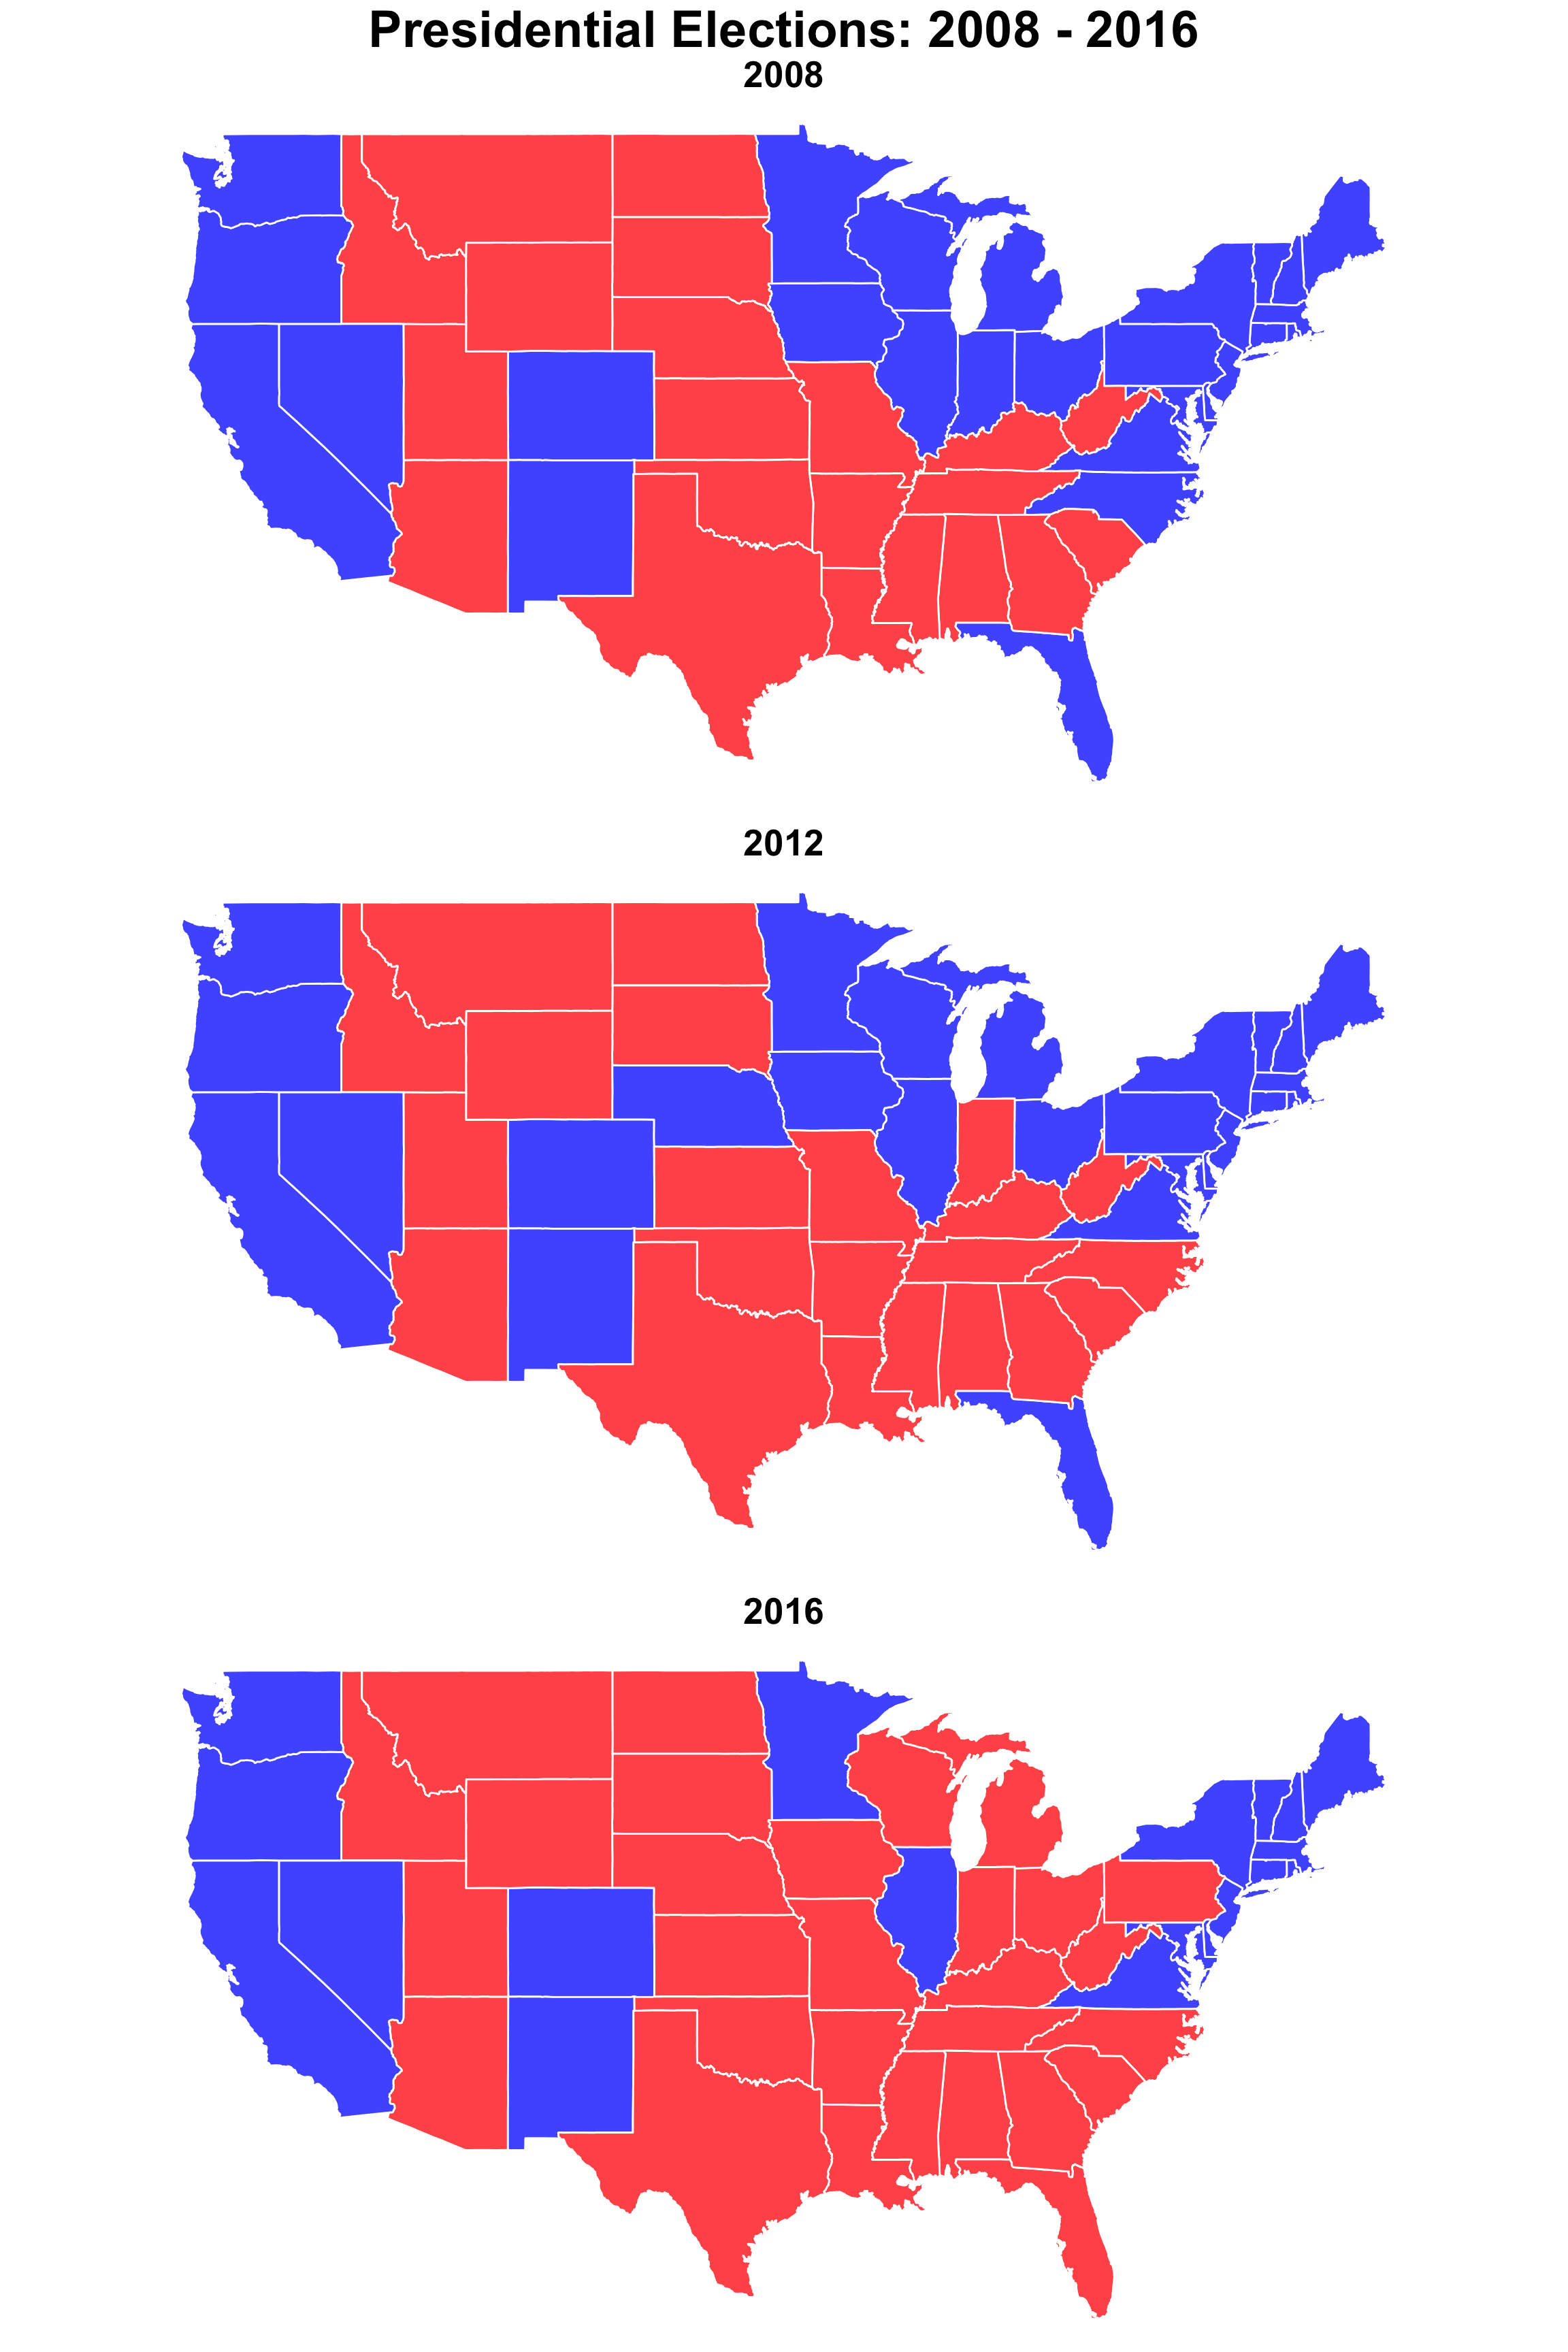
dat_2008_2016 %>%
  arrange(percent) %>%
  select(year, state, candidate, percent) %>%
  unique()
## year state candidate percent
## 1 2016 utah Trump, Donald J. 45.54
## 60 2016 minnesota Clinton, Hillary 46.88
## 433 2016 michigan Trump, Donald J. 47.59
## 1263 2016 new hampshire Clinton, Hillary 47.60
## 1388 2016 wisconsin Trump, Donald J. 47.78
## 1776 2016 maine Clinton, Hillary 47.97
## 2175 2016 colorado Clinton, Hillary 48.16
## 2254 2016 new mexico Clinton, Hillary 48.26
## 2332 2016 pennsylvania Trump, Donald J. 48.58
## 2504 2016 arizona Trump, Donald J. 49.01
## 2653 2016 florida Trump, Donald J. 49.02
## 3525 2016 nevada Clinton, Hillary 49.18
## 3595 2008 missouri McCain, John 49.43
## 3910 2008 montana McCain, John 49.53
## 4148 2008 north carolina Obama, Barack H. 49.85
## 4930 2008 indiana Obama, Barack H. 49.97
## 5187 2012 florida Obama, Barack H. 50.01
## 6059 2016 virginia Clinton, Hillary 50.15
## 6793 2016 north carolina Trump, Donald J. 50.46
## 7575 2012 north carolina Romney, Mitt 50.53
## 8357 2012 ohio Obama, Barack H. 50.67
## 8595 2008 florida Obama, Barack H. 51.04
## 9467 2016 georgia Trump, Donald J. 51.05
## 9848 2012 virginia Obama, Barack H. 51.25
## 10582 2012 colorado Obama, Barack H. 51.49
## 10661 2008 ohio Obama, Barack H. 51.51
## 10899 2016 iowa Trump, Donald J. 51.75
## 11155 2016 oregon Clinton, Hillary 51.96
## 11391 2012 pennsylvania Obama, Barack H. 52.08
## 11563 2012 new hampshire Obama, Barack H. 52.17
## 11688 2008 georgia McCain, John 52.24
## 12069 2012 iowa Obama, Barack H. 52.27
## 12325 2016 texas Trump, Donald J. 52.53
## 13413 2012 nevada Obama, Barack H. 52.66
## 13483 2008 virginia Obama, Barack H. 52.72
## 14217 2012 minnesota Obama, Barack H. 52.84
## 14590 2012 new mexico Obama, Barack H. 53.07
## 14668 2008 south dakota McCain, John 53.16
## 14834 2008 north dakota McCain, John 53.25
## 14939 2012 georgia Romney, Mitt 53.33
## 15320 2016 delaware Clinton, Hillary 53.35
## 15414 2012 wisconsin Obama, Barack H. 53.38
## 15802 2008 colorado Obama, Barack H. 53.66
## 15881 2008 arizona McCain, John 53.67
## 16030 2012 arizona Romney, Mitt 53.67
## 16179 2012 missouri Romney, Mitt 53.76
## 16494 2016 ohio Trump, Donald J. 53.79
## 16732 2008 south carolina McCain, John 53.87
## 17036 2012 indiana Romney, Mitt 54.15
## 17293 2008 iowa Obama, Barack H. 54.17
## 17549 2008 minnesota Obama, Barack H. 54.24
## 17922 2012 michigan Obama, Barack H. 54.30
## 18752 2016 washington Clinton, Hillary 54.30
## 19297 2008 new hampshire Obama, Barack H. 54.38
## 19422 2012 south carolina Romney, Mitt 54.56
## 19726 2012 oregon Obama, Barack H. 54.64
## 19962 2008 pennsylvania Obama, Barack H. 54.65
## 20134 2016 connecticut Clinton, Hillary 54.65
## 20225 2016 south carolina Trump, Donald J. 54.94
## 20529 2012 mississippi Romney, Mitt 55.29
## 20911 2012 montana Romney, Mitt 55.36
## 21149 2016 new jersey Clinton, Hillary 55.45
## 21354 2008 nevada Obama, Barack H. 55.51
## 21424 2008 texas McCain, John 55.51
## 22512 2016 rhode island Clinton, Hillary 55.54
## 22578 2008 west virginia McCain, John 55.72
## 22951 2016 illinois Clinton, Hillary 55.96
## 23280 2012 washington Obama, Barack H. 56.16
## 23825 2008 mississippi McCain, John 56.18
## 24207 2008 wisconsin Obama, Barack H. 56.34
## 24595 2012 maine Obama, Barack H. 56.44
## 24994 2016 montana Trump, Donald J. 56.47
## 25232 2008 kansas McCain, John 56.61
## 25345 2008 nebraska McCain, John 56.73
## 25553 2008 new mexico Obama, Barack H. 56.91
## 25631 2016 missouri Trump, Donald J. 56.92
## 25946 2016 kansas Trump, Donald J. 57.01
## 26059 2016 indiana Trump, Donald J. 57.12
## 26316 2016 new york Clinton, Hillary 57.18
## 26811 2012 texas Romney, Mitt 57.19
## 27899 2008 new jersey Obama, Barack H. 57.27
## 28104 2008 kentucky McCain, John 57.40
## 28501 2008 oregon Obama, Barack H. 57.42
## 28737 2008 michigan Obama, Barack H. 57.43
## 29567 2012 illinois Obama, Barack H. 57.61
## 29896 2008 tennessee McCain, John 57.63
## 30185 2008 washington Obama, Barack H. 57.65
## 30730 2008 maine Obama, Barack H. 57.74
## 31129 2012 louisiana Romney, Mitt 57.78
## 31779 2012 south dakota Romney, Mitt 57.89
## 31945 2016 mississippi Trump, Donald J. 57.94
## 32327 2012 connecticut Obama, Barack H. 58.31
## 32418 2012 new jersey Obama, Barack H. 58.34
## 32623 2008 louisiana McCain, John 58.56
## 33273 2012 delaware Obama, Barack H. 58.61
## 33367 2016 louisiana Trump, Donald J. 58.62
## 34017 2012 north dakota Romney, Mitt 58.65
## 34122 2008 arkansas McCain, John 58.72
## 34434 2016 idaho Trump, Donald J. 59.26
## 34667 2012 kansas Romney, Mitt 59.77
## 34780 2016 nebraska Trump, Donald J. 59.89
## 34988 2012 tennessee Romney, Mitt 60.04
## 35277 2012 nebraska Romney, Mitt 60.27
## 35485 2012 california Obama, Barack H. 60.35
## 36001 2012 kentucky Romney, Mitt 60.51
## 36398 2012 arkansas Romney, Mitt 60.57
## 36710 2016 arkansas Trump, Donald J. 60.57
## 37022 2008 connecticut Obama, Barack H. 60.60
## 37113 2012 massachusetts Obama, Barack H. 60.78
## 37399 2008 new york Obama, Barack H. 60.83
## 37894 2008 alabama McCain, John 60.89
## 38096 2016 massachusetts Clinton, Hillary 60.98
## 38382 2008 california Obama, Barack H. 61.10
## 38898 2016 vermont Clinton, Hillary 61.12
## 39027 2012 alabama Romney, Mitt 61.22
## 39229 2012 new york Obama, Barack H. 61.31
## 39724 2016 maryland Clinton, Hillary 61.31
## 40290 2008 idaho McCain, John 61.53
## 40523 2016 south dakota Trump, Donald J. 61.53
## 40689 2008 illinois Obama, Barack H. 61.93
## 41018 2008 delaware Obama, Barack H. 61.94
## 41112 2008 massachusetts Obama, Barack H. 62.09
## 41398 2008 maryland Obama, Barack H. 62.14
## 41964 2012 maryland Obama, Barack H. 62.21
## 42530 2016 california Clinton, Hillary 62.26
## 43046 2016 kentucky Trump, Donald J. 62.54
## 43443 2008 utah McCain, John 62.59
## 43502 2012 west virginia Romney, Mitt 62.65
## 43875 2016 alabama Trump, Donald J. 62.72
## 44077 2012 rhode island Obama, Barack H. 62.90
## 44143 2008 rhode island Obama, Barack H. 63.13
## 44209 2016 tennessee Trump, Donald J. 63.62
## 44498 2016 north dakota Trump, Donald J. 64.15
## 44603 2012 idaho Romney, Mitt 65.22
## 44836 2016 oklahoma Trump, Donald J. 65.32
## 45120 2008 oklahoma McCain, John 65.65
## 45404 2008 wyoming McCain, John 66.14
## 45472 2012 oklahoma Romney, Mitt 66.77
## 45756 2012 vermont Obama, Barack H. 67.03
## 45885 2008 vermont Obama, Barack H. 67.76
## 46014 2016 west virginia Trump, Donald J. 68.63
## 46387 2012 wyoming Romney, Mitt 69.21
## 46455 2016 wyoming Trump, Donald J. 70.98
## 46523 2012 utah Romney, Mitt 72.82
## 46582 2012 district of columbia Obama, Barack H. 91.15
## 46592 2016 district of columbia Clinton, Hillary 92.82
## 46602 2008 district of columbia Obama, Barack H. 92.85Look at margins
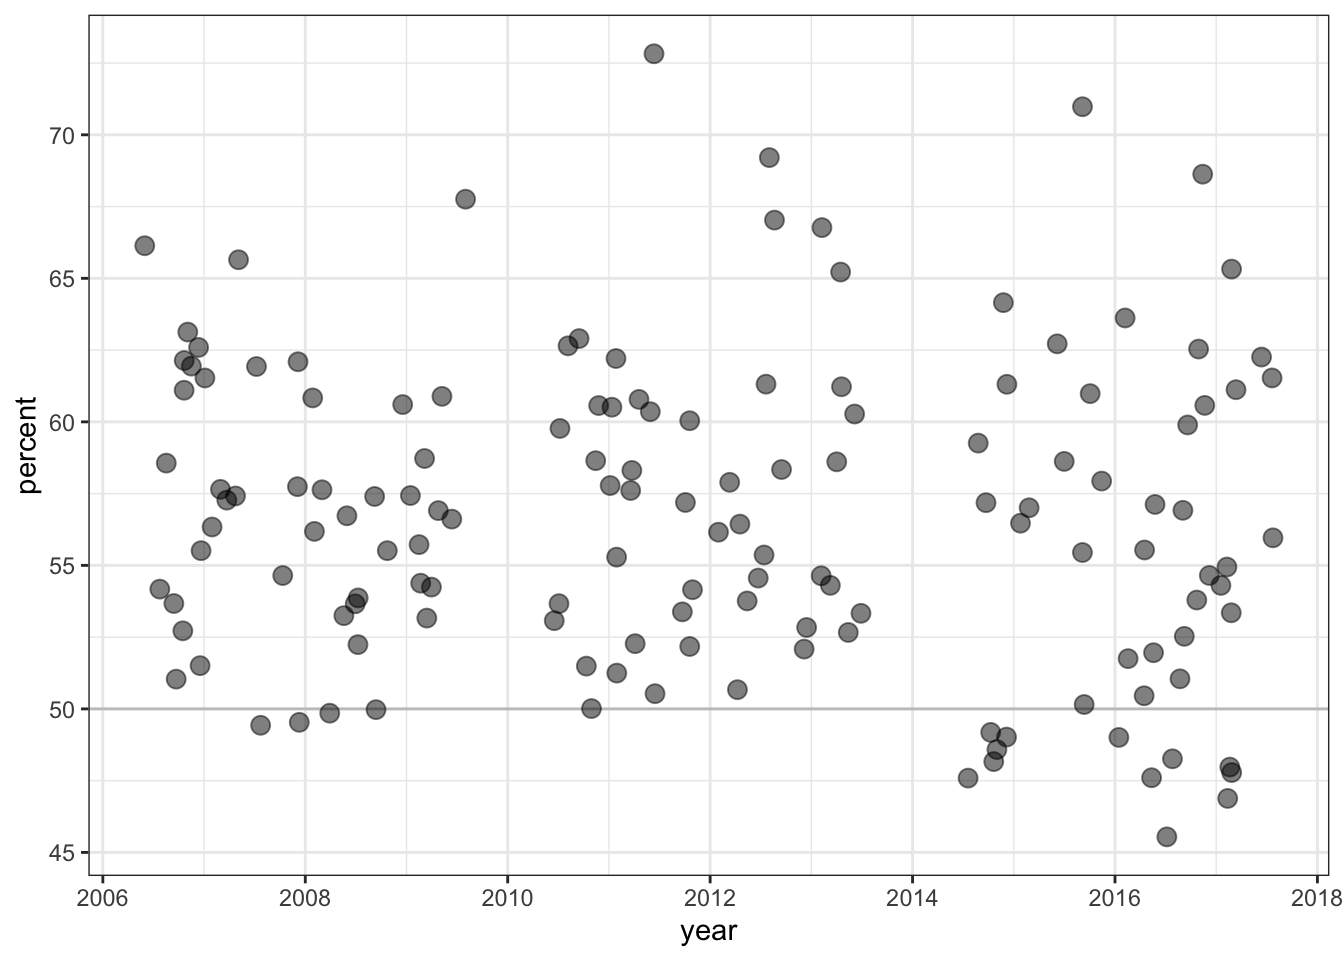
dat_2008_2016 %>%
  filter(percent<90) %>% #This excludes DC (sorry, DC)
  arrange(percent) %>%
  select(year, state, candidate, percent) %>%
  unique() %>%
  ggplot(aes(x=year, y=percent))+
  geom_hline(yintercept = 50, alpha=0.2)+
  geom_jitter(size=3, alpha=0.5)+
  theme_bw()